
A channel partner who buys ₹1 crore of stock from a brand may look more valuable than one who buys ₹70 lakh. But what happens if the first partner is sitting on excess inventory while the second is consistently moving products into the market?
That is where sell-in, sell-out & partner performance data become important. Sell-in tells a brand what has moved into the channel; sell-out tells it what is moving through the market. Neither number, by itself, is enough to determine whether a partner is creating sustainable value.
Hindustan Coca-Cola Beverages describes sell-in as the movement of products from the manufacturer into distribution and sell-out as movement from retail to consumers. It also warns that focusing only on sell-in can lead to an incorrect view of demand and contribute to overstocking, stockouts or missed opportunities.
For channel leaders, the real question is therefore not “Which partner buys the most?” It is: Which partners convert inventory, distribution and market opportunity into sustainable, profitable growth?
Why Sell-In Alone Cannot Tell You Which Channel Partners Are Valuable
Sell-in is an important commercial metric. It shows how much product a distributor, dealer, stockist or other channel partner has purchased from the brand during a period. The problem begins when sell-in becomes the only measure of partner performance.
A large order could represent genuine demand. It could also reflect seasonal stocking, a promotional scheme, forward buying, a new product launch or inventory that has not yet moved through the channel. Without downstream information, the brand cannot easily distinguish between these situations.
This is why a high-value channel partner should be evaluated using multiple signals rather than a single sales number.
A channel strategy research recommends using a channel partner performance scorecard with a limited number of clearly defined metrics. Its sample scorecard includes revenue growth, payment behaviour, business development, inventory availability and demand forecast accuracy.
Sell-In vs Sell-Out: What Is the Difference?
The simplest way to understand the difference is to look at where the product is moving.
| Metric | What it measures | What it helps answer |
| Sell-in | Brand → distributor/ dealer/ stockist | How much has entered the channel? |
| Secondary sales | Distributor/dealer → retailer or downstream channel | How much is moving through the distribution network? |
| Sell-out | Retail → consumer, where data is available | How much is actually being purchased from the market? |
| Inventory | Stock remaining in the channel | How much product is still waiting to move? |
The exact definition of sell-out can vary by category and channel structure, so brands should establish a consistent definition before comparing partners.
The important distinction is that sell-in measures upstream movement while sell-out provides a view of downstream movement. HCCB notes that sell-in indicates how effectively stock is pushed into trade, while sell-out provides insight into consumer movement and product velocity.
What sell-in tells you:
- Purchase volume
- Order frequency
- Revenue contribution
- Distributor buying patterns
- Response to schemes or promotions
- Upstream demand
It is particularly useful for understanding the commercial relationship between the brand and its channel partners.
What sell-in does not tell you
It does not automatically tell you:
- Whether the stock has been sold onward
- Whether inventory is ageing
- Whether consumers are buying the product
- Whether the partner is covering enough outlets
- Whether growth is sustainable
- Whether the partner is profitable to serve
That distinction is central to identifying high-value partners.
The Sell-In and Sell-Out Gap Can Reveal Hidden Channel Problems
Suppose a distributor records ₹1 crore of sell-in during a quarter but only ₹55 lakh of sell-out during the same period.
The ₹45 lakh difference does not automatically mean the distributor is underperforming. The partner may have started the period with low inventory, may be preparing for a seasonal spike, or may have received stock toward the end of the reporting period. But it is a signal that deserves investigation. A simple starting point is:
Sell-In / Sell-Out Gap = Sell-In − Sell-Out
For inventory analysis, a more useful relationship is:
Closing Inventory = Opening Inventory + Sell-In − Sell-Out
Returns, transfers, damages and other adjustments may need to be incorporated depending on the business.
Why the gap should not be interpreted in isolation
A growing gap can mean several different things:
- Inventory is building faster than demand.
- A promotional or seasonal stocking event has occurred.
- Sell-out data is delayed or incomplete.
- The partner is purchasing ahead of expected demand.
- The brand is pushing inventory into a market without enough downstream movement.
- There is a supply or reporting timing mismatch.
The job of channel analytics is therefore not to label a partner based on one gap. It is to identify why the gap exists.
How to Identify High-Value Channel Partners
A high-value channel partner is not necessarily the partner with the highest current revenue. A more useful assessment considers current contribution, market movement, growth, coverage, portfolio productivity & profitability.
1. Start with revenue contribution
Revenue remains an important starting point because it shows the partner’s current commercial importance. But compare revenue over time rather than looking at a single period. A partner generating ₹1 crore this year after declining from ₹1.5 crore may require more attention than a partner generating ₹80 lakh with consistent growth.
The direction of the number can sometimes be more informative than the number itself.
2. Compare sell-in with sell-out
This is where partner evaluation becomes more meaningful. A partner with high sell-in and high sell-out is demonstrating strong product movement. A partner with high sell-in but significantly weaker downstream movement requires a closer look at inventory, timing and market conditions.
The reverse can also happen. A partner with relatively low sell-in but strong sell-out may be constrained by supply, credit limits, assortment or insufficient allocation.
3. Look at growth consistency
One large order can distort a partner’s apparent performance. Look at monthly or quarterly trends to identify whether growth is consistent or driven by isolated spikes. A partner that steadily increases sell-out across multiple periods may represent a stronger growth opportunity than one whose sales fluctuate sharply around scheme periods.
4. Measure market coverage
Sales volume becomes more meaningful when you understand where it comes from. Consider:
- Number of productive outlets
- Geographic coverage
- Outlet productivity
- Active retailer/dealer base
- New outlet activation
- Coverage of priority markets
Brands work on route-to-market transformation illustrates why this matters: in one Indian cables business, the company used town-level market mapping and outlet coverage analysis to identify expansion opportunities and improve last-mile control.
Image idea: Create a map-style visual showing two distributors with the same revenue but different outlet coverage and productivity.
5. Evaluate SKU and portfolio productivity
A partner selling ₹50 lakh through three fast-moving SKUs may have a very different strategic value from one selling ₹50 lakh across a broader portfolio. Look at:
- SKU breadth
- New-product adoption
- Product mix
- Cross-selling
- Category penetration
- Fast- and slow-moving SKU contribution
This helps distinguish a partner who is simply responding to existing demand from one who is actively developing the brand’s portfolio.
6. Include profitability
Revenue does not equal value. A partner may generate substantial sales but require high discounts, frequent servicing, significant credit exposure, high return rates or disproportionate sales support.
Partner profitability should therefore consider the economics of serving that partner, not just the invoice value.
A commercial strategy guidance specifically identifies channel profitability analysis, margin decomposition and cost-to-serve modelling as tools for understanding the economics of customers and channels.
7. Consider future value
Some partners have strong current performance. Others have strong potential. A regional distributor with moderate current sales but excellent market coverage, growing sell-out and strong execution capability may deserve attention because its future value could be substantially higher than its current revenue suggests. This is where partner performance analysis connects directly with channel partner lifetime value.
Four Channel Partner Patterns Brands Should Watch
Combining sell-in and sell-out creates a more useful starting point for partner diagnosis.
| Sell-In | Sell-Out | What it may indicate | What to investigate |
| High | High | Strong commercial activity and downstream movement | Growth, profitability, market coverage |
| High | Low | Inventory build-up, timing difference or weak downstream movement | Stock age, inventory, promotions, demand |
| Low | High | Potential supply constraint or under-servicing | Availability, allocation, credit and capacity |
| Low | Low | Weak current activity or limited opportunity | Demand, coverage, capability and partner economics |
This table should not be treated as a scoring model. It is a diagnostic starting point. For example, high sell-in with low sell-out is not automatically a problem. It tells the sales team where to investigate before deciding what action is required.
Which Channel Partner Performance Metrics Should You Track?
The objective should not be to create a dashboard with 30 metrics that nobody uses. It recommends limiting channel partner scorecards to roughly five to seven key metrics, with clear definitions and performance thresholds. A practical scorecard could include:
| Performance area | Example metric | Why it matters |
| Revenue | Revenue growth | Shows commercial momentum |
| Market movement | Sell-out growth | Shows downstream demand |
| Inventory | Stock cover / inventory days | Indicates potential inventory pressure |
| Coverage | Productive outlets | Shows market reach |
| Portfolio | SKU breadth | Shows portfolio development |
| Economics | Contribution/ margin | Shows partner profitability |
| Execution | Target achievement | Shows delivery against plan |
The exact metrics should vary by industry. A paint distributor, an FMCG distributor and an industrial dealer may need different scorecards. The principle is simple: measure the behaviours and outcomes that actually matter to the channel strategy.
Why Channel Partner Performance Data Often Gives an Incomplete Picture
In many businesses, the problem is not a lack of data. It is that the data exists in different places.
Sell-in may sit in an ERP system. Distributor inventory may sit in a DMS. Field teams may capture outlet visits separately. Sell-out may come from distributors or retailers, while partner engagement and incentive data may sit in another platform. This makes it difficult to answer a basic question:
Why did this partner’s performance change?
India FMCG research highlights the growing importance of digital tools for inventory management, order tracking, and performance analytics. Its research also found that 48% of distributors considered order placement through fulfilment the most impactful interaction with FMCG brands, while 20% identified continuous engagement as most impactful.
The issue is therefore not simply collecting more data. It is creating a connected view of partner performance.
How to Build a More Reliable Channel Partner Performance View
A useful performance view should connect four layers.
- Commercial data: Sell-in, orders, revenue and purchase frequency.
- Market data: Sell-out, secondary sales, outlet coverage and product movement.
- Operational data: Inventory, stock cover, returns, fulfilment and availability.
- Partner economics: Margins, incentives, servicing costs, credit and profitability.
Once these layers are connected, a brand can move from asking more important questions, which are much more useful for a channel leader.
What Should a Channel Partner Performance Dashboard Show?
A practical dashboard should allow a sales or channel manager to move from the overall network to an individual partner without losing context.
Partner → Territory → Sell-In → Inventory → Sell-Out → Coverage → Growth → Profitability → Risk
For each partner, the dashboard could show:
- Current revenue
- Sell-in trend
- Sell-out trend
- Inventory position
- Stock cover
- Purchase frequency
- SKU breadth
- Productive outlets
- Target achievement
- Margin/contribution
- Returns and claims
- Partner engagement
- Performance trend
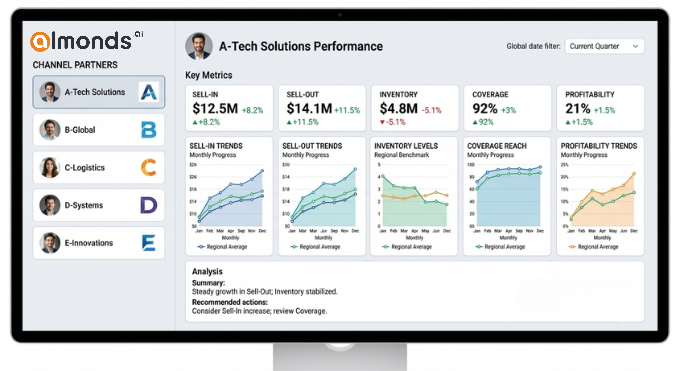
The value comes from being able to see the relationships between these numbers rather than viewing them as separate reports.
From Partner Performance to Partner Lifetime Value
Performance data tells you what is happening now. Channel partner lifetime value helps you think about what that performance could mean over the length of the relationship.
A partner’s current revenue, profitability, growth potential and retention probability all influence its long-term value. That is why the highest-revenue partner today is not automatically the partner that should receive the most strategic attention.
Similarly, declining purchase frequency, falling sell-out or reduced market coverage can become early indicators of channel partner churn.
This creates a more connected approach to channel management: Measure performance → identify value → detect risk → prioritise action → track change
The Bottom Line
A channel partner’s value cannot be understood from sell-in alone.
Sell-in tells you what has entered the channel. Sell-out tells you more about downstream movement. Inventory explains what is still sitting between the two. Coverage, growth, portfolio productivity and profitability help explain whether that movement is creating sustainable business value.
As India’s retail mix continues to change, channel performance is becoming harder to understand through a single sales report. NIQ’s Q2 2026 FMCG snapshot, for example, puts e-commerce at 7% of FMCG sales nationally, while also highlighting differences between urban and rural growth and the continuing importance of modern trade and e-commerce.
The practical lesson is straightforward: Don’t rank channel partners only by what they buy. Evaluate them by what they help the business achieve.
Frequently Asked Questions
What is the difference between sell-in and sell-out?
Sell-in generally refers to products moving from a manufacturer or brand into its distribution network. Sell-out generally refers to products moving from the retail channel to consumers. The exact definition can vary by industry and channel structure.
How do you identify high-value channel partners?
High-value channel partners should be evaluated using multiple factors, including revenue contribution, sell-out, growth, market coverage, SKU productivity, profitability and future growth potential. No single metric provides a complete view of partner value.
Why is sell-out important for measuring channel partner performance?
Sell-out provides visibility into downstream product movement and market demand. Comparing sell-out with sell-in can help brands identify inventory accumulation, supply constraints and differences between upstream purchases and downstream movement.
What does high sell-in but low sell-out indicate?
It may indicate inventory accumulation, forward buying, seasonal stocking, promotional timing or weaker downstream demand. It should be investigated alongside opening inventory, closing inventory, stock age and market conditions rather than treated automatically as poor partner performance.
What metrics should be used to measure distributor performance?
Common metrics include revenue growth, sell-out growth, inventory or stock cover, productive outlet coverage, SKU breadth, target achievement and partner profitability. The appropriate metrics depend on the category, route-to-market model and business objectives.
How do you calculate the sell-in and sell-out gap?
A basic calculation is:
Sell-In / Sell-Out Gap = Sell-In − Sell-Out
However, the result needs to be interpreted alongside opening and closing inventory, returns, transfers and reporting-period differences.
Is there a standard healthy sell-in-to-sell-out ratio?
There is no universal healthy ratio that applies to every channel or category. Inventory cycles, seasonality, product type, promotional periods, supply lead times and distribution models can all affect the relationship between sell-in and sell-out.
How can brands improve channel partner performance using data?
Brands can connect sales, inventory, sell-out, outlet coverage and profitability data to create a unified partner-performance view. This allows channel teams to identify performance changes earlier and priorities partners and territories based on evidence rather than sales volume alone.